

Today in 30 Seconds
Core idea: Cardinal Health ($CAH ( ▼ 0.33% )) gained +467.25% (price only) from the Nov 16, 2021 close of $50.04 to the Nov 16, 2026 close of $283.85. $10,000 invested on that start date became about $56,725. A $500-a-month plan, 60 buys from November 2021 through October 2026, turned $30,000 into about $88,153 at the Nov 16, 2026 close.
Honest catch: The Nov 16, 2026 close sits about 0.85% (about 0.9%) below the $286.29 intraday high from Nov 5, 2026. Past pace rarely continues, especially when a stock is this close to a recent high.
5-Year Horizon: The lowest close in that window was $45.87 on Dec 1, 2021. These examples are price only: no dividends, fees, or taxes, and they are not forecasts.
Tip: A lump-sum result and a monthly buying plan can tell different stories. Compare both, and treat a move toward a recent high as a reason to re-check the numbers, not as a reason to chase.
Market declines can create entry points, but a falling price is not proof of value. A simple plan is to keep a watchlist of businesses you already understand, keep investing on a schedule if that fits your plan, and avoid assuming the next rebound will look like the last one.
5-Year Horizon: CAH in 20 seconds
$10,000 put into Cardinal Health on Nov 16, 2021, at the $50.04 close, became about $56,725 by the Nov 16, 2026 close of $283.85 (+467.25%, price only). Investing $500 a month instead, 60 buys from November 2021 through October 2026, turned $30,000 into about $88,153. The catch: the Nov 16, 2026 close sits about 0.85% (about 0.9%) below the $286.29 intraday high from Nov 5, 2026.

Why click: the full breakdown shows the $500 monthly plan, CAH's lowest close in the window ($45.87 on Dec 1, 2021), and the one thing to watch after this autumn surge.
Gold Is Soaring But Are You Getting Paid Monthly?

While gold posts its strongest gains since 1979, income expert Tim Plaehn reveals a quiet $15 fund turning this historic surge into massive monthly income: up to $1,152 every month.
Discover here the gold income strategy that pays you.
A Written Plan for Buying After a Sharp Market Drop
The Nasdaq-100 just had its worst day since March 2020. By Friday, chip stocks were up as much as 6%. A single day this bad for that index has not shown up in about six years, and it can look like a chance to get into names that had felt too expensive. It can also feel scary while you are living through it.
One way to take some of the emotion out of a day like that is to keep a written plan and update it regularly, so the work is already done before the sell-off arrives. The plan described here is a framework for thinking about reserve cash after a sharp decline. It is education, not a recommendation to buy or sell any stock.
Most Sharp One-Day Drops Recovered, but Not All of Them
Over the last 30 years, the S&P 500 has had 15 sell-offs in which it dropped 4% or more in a single day. Even if you bought the day before the drop, which is the worst possible moment in this comparison, you were still higher a year later 11 out of 15 times, and the typical gain was about 13%. If you bought on the day it dropped, you were up a year later 12 out of 15 times, and the typical gain was about 18%. Most of the time, the market was back to where it stood before the drop in less than a month.
The exceptions matter. After the dot-com crash, 9/11, and 2008, the market was still lower a year later. In 2008, it took more than a year and a half just to get back to even. That is why this plan does not call for putting all of your money into the market on a single day. It is built to take emotion out of the moment, and it starts with cash set aside in advance.
Three Boxes Before Using Reserve Cash
The foundation is to keep between 5% and 10% of a portfolio in cash, sometimes called dry powder. On ordinary pullbacks, the plan simply keeps dollar-cost averaging into companies already on the watchlist. A day as severe as that Thursday does not come around very often. That is when the plan may double the usual dollar-cost averaging contribution, and that is what the reserve cash is for.
Every stock that receives that reserve cash has to check three boxes, with no exceptions. The first is simple: did it actually get pulled back? The gauge is that a stock has to fall about as much as the Nasdaq-100 did that day, give or take about 1%. $AAPL ( ▲ 0.1% ) is the example. It only fell about 1.5% on that Thursday, so it did not qualify for reserve cash, even as a well-known company. A three-year forecast used in this plan also had it growing at about 12% a year, among the lower figures for the big names on the watchlist.
The second box is whether the stock is trading below an estimate of what it is worth, with room to run. One approach is to build a personal fair-value model. For people who are just getting started, large brokerages such as Fidelity and Schwab offer free research reports that include fair-value estimates.
The third box is the long game. The plan is not trying to catch a single-day bounce. It looks for a business that can keep growing for years, and it keeps a rolling three-year forecast on every company on the watchlist, looking three to five years out. For younger companies that are not making money yet, the substitute is how much business they have already signed in contracts that can turn into revenue later.
How much reserve cash to put to work should depend on the portfolio you already have. The names below are the ones that cleared this checklist in that episode, described as if starting from scratch.
1. Nvidia $NVDA ( ▼ 2.96% ): Still the AI Chip Leader
In its last quarter, Nvidia brought in about $96 billion in sales, roughly double what it did a year earlier, and its next generation of chips was just starting to ship. On that Thursday it lost about $450 billion in value in a single day and fell about 9%, so it easily cleared the pullback test. It is on the list because it is still the leader in AI chips, and demand had not really slowed down. A valuation ladder used in this plan called it severely undervalued, and a three-year forecast had it growing about 38% a year. Take figures like that with a grain of salt. They can change from day to day.
In the portfolio this plan came from, Nvidia already made up about 12%. Buying more would have pushed that risk higher than the holder wanted to go, so no shares were added that Thursday. If Nvidia had been only a small percentage of the portfolio going into that day, the plan would have called for buying more.
2. Taiwan Semiconductor $TSM ( ▲ 0.82% ): Paid No Matter Whose Chip Wins
Nvidia, AMD, and even Apple draw up chip designs, and Taiwan Semiconductor is the factory that actually builds almost every advanced chip. Its sales were up about 41% last quarter, and its CEO said AI demand is still bigger than what the company can supply. That is why it plans to more than double its most advanced chip-making capacity next year. It is on the list because it gets paid no matter whose chip wins. It fell about 11% on Thursday, and a three-year forecast used in this plan had it growing at about 25% a year. The system said to average in on schedule, and that is why it was bought that day.
3. $ASML ( ▲ 0.88% ): The Machines Behind the Most Advanced Chips
ASML is described here as the only company in the world that makes the machines needed for the most advanced chips. Sales were up about 55% last quarter, and the company has said it will not be able to build enough of those machines to meet demand in 2027 or 2028. When demand is bigger than what it can make, it gets to set the price. It fell about 9% on Thursday, and a three-year forecast used in this plan had it growing at about 26% a year. This was another name purchased under the plan, with a three-to-five-year horizon rather than a short-term trade.
4. AMD $AMD ( ▲ 5.35% ): The Most Realistic Alternative
AMD has lived in Nvidia's shadow for years, but that has started to change. Its data center business almost doubled in a single year, and it has a deal with OpenAI that it expects to be worth over $100 billion over the next few years. It is on the list as the most realistic alternative to Nvidia that the large AI companies have available. It was hit as hard as almost any of the big names, falling about 17% on Thursday. A three-year forecast used in this plan had it growing at about 49% a year, again with a grain of salt, and it was the third large name purchased that day.
5. Lam Research $LRCX ( ▲ 0.47% ): The Tools That Build the Circuits
Lam Research makes the machines that build the tiny circuits inside a chip, layer by layer, and those machines sit in the factories of almost every large chip maker. It had just posted the best quarter in its history, with sales up about 54% from a year earlier, and it made enough cash to buy back about $1 billion of its own stock. It is on the list because the more chips the world needs, the more of these machines get bought. It also fell hard on Thursday, down 16%. A three-year forecast used in this plan had it growing at about 34% a year. The risk being watched is that about a third of its sales come from China.
6. Credo Technology $CRDO ( ▼ 0.82% ): The Cables Inside the Data Center
Mid-size names get less of the reserve cash than the large ones. Credo Technology makes the cables that connect AI servers to one another inside a data center. Those cables use less power and fail less often than the older approach. Sales more than tripled last year, and the company expects sales to grow more than 80% again this year. It is on the list because the more AI servers get packed together, the more of those connections are needed. The stock had already been sliding after management warned that it would keep a little less profit from each sale, and it fell about 18% on Thursday. That margin warning is the risk to watch. The average analyst 12-month price target implied more than 100% upside, while a three-year forecast used in this plan had it growing at about 46% a year, a more conservative figure.
7. Astera Labs $ALAB ( ▲ 2.43% ): Connecting the Parts of an AI Server
Astera Labs makes the chips inside AI servers that let the processors, the memory, and the network talk to one another. Its newest product ties a whole cabinet of AI chips together and had just become its biggest seller. Sales were up about 150% from a year earlier. It is on the list because it can benefit whether large cloud companies buy Nvidia or AMD, or build their own chips. It was one of the weakest names on Thursday, falling about 20%. A three-year forecast used in this plan had it growing at about 45% a year, while analysts also saw more than 100% upside over the next 12 months.
8. IonQ $IONQ ( ▼ 5.48% ): Signed Contracts Instead of a Profit Forecast
IonQ is a quantum computing company that had just posted a record quarter, with quantum sales more than doubling. One of its machines is going into Nvidia's quantum research center. It also had about $1.2 billion in signed contracts that had not yet turned into sales, more than double what it expected to bring in this entire year. It is on the list because it is a quantum company that is already selling machines and growing revenue. It fell only about 11%. It does not make a profit yet, so a three-year earnings forecast was not useful here. The signed contracts are what checked the third box.
9. Rambus $RMBS ( ▲ 0.19% ): Memory Chips That Keep Data on Time
The two smallest names get the smallest slices of reserve cash. Rambus makes the little chips that sit on the memory inside almost every server and keep the data moving on time. AI servers are packed with memory, and its sales had just hit a record, up about 22% from a year earlier. It is on the list because more AI servers means more memory, and more memory means more of its chips. It fell about 16%. A three-year forecast used in this plan had it growing at about 23% a year, still viewed as solid, while analysts were more bullish, with a 12-month forecast of 68%.
10. Cohu $COHU ( ▲ 4.41% ): Testing Chips Before They Ship
A large number of chips go through machines like Cohu's to get tested before they ship. Orders more than doubled from a year earlier, the company had just landed two of the largest cloud companies as customers, and it told investors to expect sales to grow another 30% to 40% next year. It is on the list because every one of those AI chips has to be tested, and Cohu had just swung back into profit. On Thursday it dropped about 21%, the steepest decline on this list.
How $100 of Reserve Cash Could Be Split
If there were $100 of dry powder to invest across the 10 names that made this checklist, the split in this plan would be $70 to the large names, $25 to the mid-size names, and $5 to the more volatile small caps. The reason is that when the selling stops, the larger flows of money tend to come back into the biggest companies first.
A review of some of the worst days for the Nasdaq-100 since 2020 was used to illustrate that pattern. Early in the COVID crash, in March 2020, the Nasdaq-100 fell about 9% in a single day and was up about 32% just three months later. Small companies in the Russell 2000 fell even harder that day, about 11%, and were up only about 21% over the same stretch. After the worst day of the tariff episode in April 2025, the comparison was about 31% for the larger companies versus about 22% for the smaller ones. In those same stretches, the S&P 500 came back somewhere between 22% and 29%. In each of the cases reviewed, the biggest companies led the way back.
The small-cap slice stays small for a risk reason as well. Over the last 10 years, among the stocks followed in this plan, the chance that a name would fall 40% or more at some point in the next year was about 1 in 10 for the large names and about 1 in 3 for the small ones. A person might accept losing some, or even half, of that 5% small-cap slice. This plan is not willing to make the small names a much larger part of the portfolio, because it is not willing to lose a large share of the money in a short time. The large and mid-size names are treated as the anchors.
The Hardest Bounce Is Not the Test
This list is not always the one that bounces back the hardest. Some of the names above, including Lam Research, AMD, and IonQ, were among the stronger rebounds the next day. $IREN ( ▼ 3.7% ) and $OKLO ( ▼ 2.55% ) bounced even harder, and neither one made the list. There is a reason. IREN is a former Bitcoin miner turning itself into an AI cloud company, and it is burning a lot of cash to do it. It was already owned and liked in the portfolio this plan came from, but it is also carrying about $10 billion of debt. Oklo is building small nuclear reactors and does not have real sales yet. The system said new money should wait on both until the businesses are actually proven. The point is not to chase a bounce just because it was missed.
Write the Plan Down Before You Need It
The list does not have to be perfect, but it does need a clear reason for each name. The value of a written plan is that when a day like that Thursday shows up, the work is checking boxes instead of panicking or doing last-second research. Build the list, put it somewhere you can see it, and update it. The next time the market falls apart, the aim is to be ready, without the emotion that usually comes with it.
This is for educational purposes only and is not financial advice. The forecasts and fair-value views mentioned above are estimates, and they can change from day to day.
5-Year Horizon $CAH ( ▼ 0.33% ): How $500 a Month Grew to About $88,153 (+467.25%)
Imagine setting aside $500 a month for $CAH ( ▼ 0.33% ) for five years, buying a fixed dollar amount on a schedule, a method called dollar-cost averaging. In our example the buy happens on the first trading day of each month, from November 2021 through October 2026 (the first buy is the Nov 1, 2021 close of $48.62, and the last buy is the Oct 1, 2026 close of $230.09): 60 buys, $30,000 in total.
5-Year Growth and Value: CAH closed at $50.04 on Nov 16, 2021 and at $283.85 on Nov 16, 2026, a price gain of +467.25%, or about 41.5% a year compounded (the steady yearly rate that would give the same total gain).
Investment Returns: In that example, the $30,000 invested via dollar-cost averaging would have been worth about $88,153 at the Nov 16, 2026 close (about 2.94 times the money put in), while a single $10,000 lump sum invested on Nov 16, 2021 would have become about $56,725. (Price only: no dividends, fees, or taxes, and these are examples, not forecasts.)
High and Low Extremes: The highest intraday mark of the window was $286.29 on Nov 5, 2026, so the Nov 16, 2026 close of $283.85 sat about 0.85% (about 0.9%) below that intraday high. The lowest close of the five-year window was $45.87 on Dec 1, 2021, about 8.3% below the $50.04 start.
Caution: past pace rarely continues. A stock sitting this close to a recent intraday high can still fall, and a five-year gain of +467.25% is not a forecast of the next five years. Use these price-only examples to understand the math of a lump sum versus a monthly plan, not as a recommendation to buy or sell.
Follow the discussion
Follow $CAH ( ▼ 0.33% ) on StockTwits: today's 5-Year Horizon, about +467.25% from Nov 16, 2021 to Nov 16, 2026 (price only); $10,000 became about $56,725.
Why click: see what other investors are saying about CAH right now, and follow the ticker so its next big move shows up in your feed.
Quick question
Tell us if this shorter format works: one question, takes a few seconds.
Hit reply and tell me what you'd watch with CAH about 0.85% below its $286.29 intraday high from Nov 5, 2026. I read every answer.
12 Surprising Money Mistakes Even Smart People Make
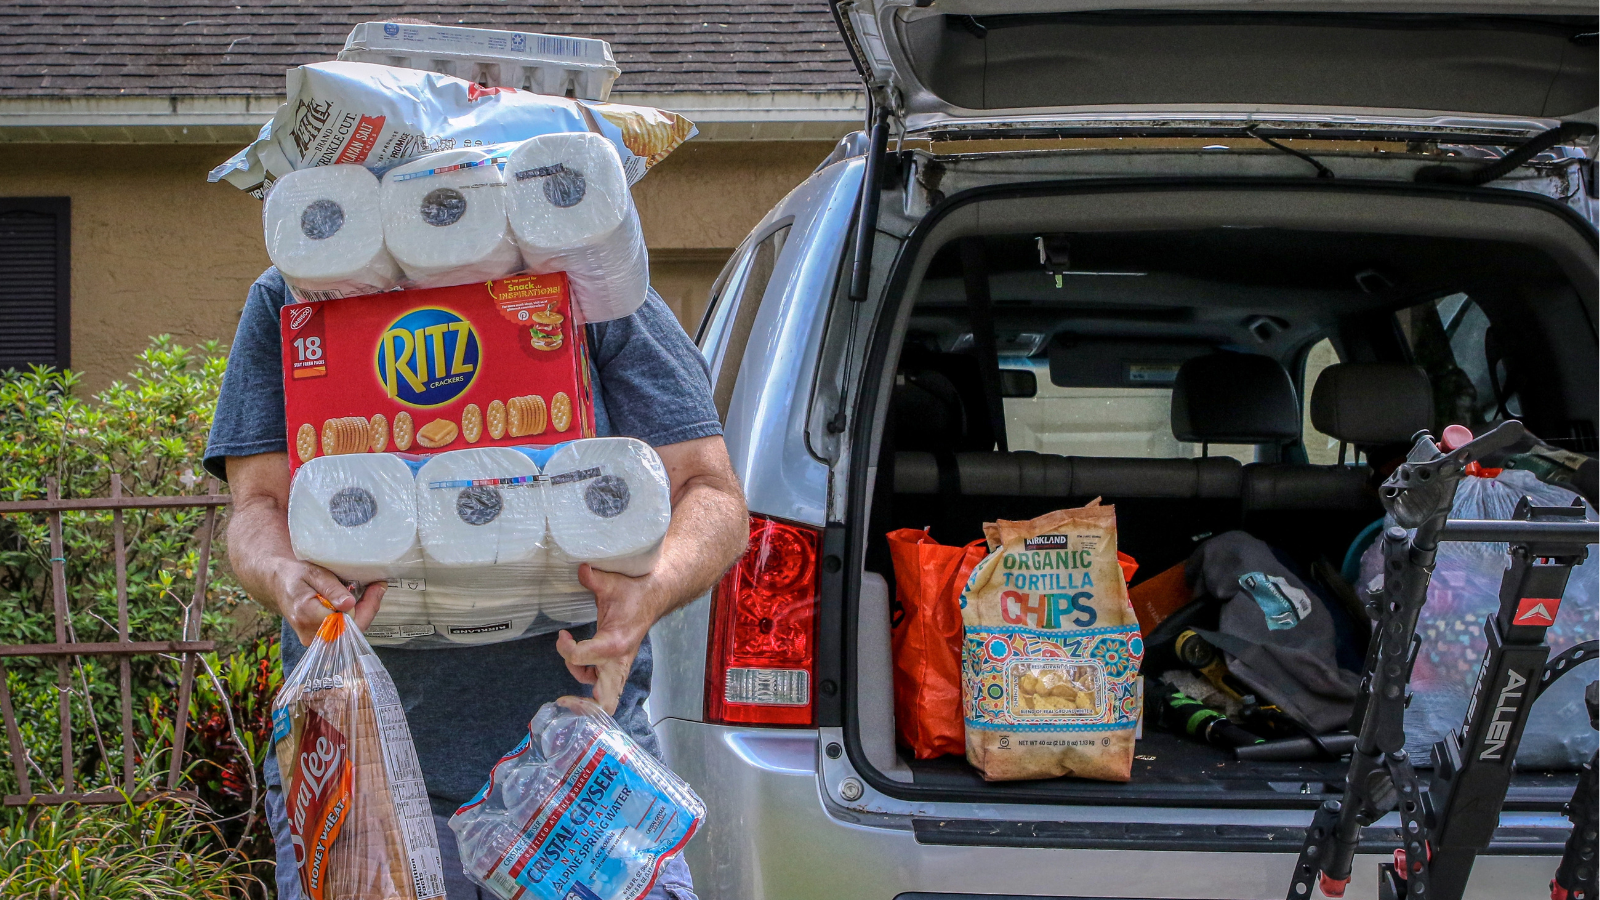
You’re smart about saving money, like shopping clearance racks, limiting eating out, and choosing affordable streaming services. However, there are still some cost-cutting tips you might not know yet. Once you discover these, you could quickly find extra cash in your pocket.
Learn More
That's it
Thank you for taking the time to read today's email.
This newsletter is for informational purposes only and should not be considered financial advice. Please consult with a financial advisor before making any investment decisions.