Sponsored by

A $100,000 portfolio does not behave like a single number once it enters the market — it becomes a structure, not just capital. In 2026, three ETFs — SCHD, JEPQ, and SCHG — demonstrate this more clearly than ever. Each starts with the same base allocation, yet each produces a fundamentally different financial outcome depending on whether markets are driven by defensive rotation, volatility monetization, or technology-led growth. What makes this comparison important is not short-term performance divergence, but how each fund responds differently as market leadership shifts. The real question is not which one is winning today, but which structure remains effective when the regime changes again.
His Father Got Parkinson's. He Built Robots Instead.

Clint Brauer grew up on his family's Kansas farm. His dad sprayed the same chemicals every American farmer sprays. Years later: Parkinson's. Clint walked away from a tech career to build a different way. Today his company, Greenfield Robotics, runs a patented fleet of autonomous bots that slice weeds with centimeter precision, day or night, herbicide-free.
Greenfield is now opening shares to everyday investors under Reg A+. Reserve during Test the Waters and you lock in a 5% bonus that can grow to 20% the week the round goes live. The US has 250 million acres at stake.
Greenfield Robotics is Testing The Waters under tier 2 of Regulation A. No money or other consideration is being solicited, and if sent in response will not be accepted. No offer to buy the securities can be accepted and no part of the purchase price can be received until the offering statement filed by the company with the SEC has been qualified by the SEC. Any such offer may be withdrawn or revoked, without obligation or commitment of any kind, at any time before notice of acceptance given after the date of qualification. An indication of interest involves no obligation or commitment of any kind. “Reserving” shares is simply an indication of interest. There is no binding commitment for investors that reserve shares in this manner to ultimately invest and purchase the shares reserved of the company, or to purchase any shares of the company whatsoever.

In this breakdown, we compare three distinct portfolio philosophies operating under the same $100K allocation: stability through dividend quality (SCHD), income generation through volatility harvesting (JEPQ), and concentrated growth exposure (SCHG). We examine how each behaves across shifting market conditions, why income and total return often diverge, and how structural design—not recent performance—determines long-term outcomes. The key insight is that these ETFs are not competing strategies, but different financial “engines” built for different environments.
Let’s embark on this transformative journey together and position your portfolio for success in this evolving market landscape!
Be sure to read through to the end to catch all the valuable insights this newsletter delivers to your inbox today.
Three months running. No losses on the open book in 2026 so far.
Adam Mesh has six open options trades on the book right now.
Every one of them is in the green.
Here's his 2026 record as of today:
• SNDA — opened Feb 26. +203. Still open.
• OWL — opened March 5. +735. Still open.
• BB — opened April 21. +474. Still open.
• ASPI — opened April 23. +800. Still open.
• NOK — opened April 30. +480. Still open.
• BULL — opened May 14. +156. Still open.
Total unrealized profit across the book: $2,848 and counting.
That's not a back-tested track record. Those are live open positions, dated and verifiable.
He'll be the first to tell you not every trade wins. He's been doing this for 30 years. He's had plenty of losers. Every trader has.
But the math behind his core strategy is built so the odds lean in his favor before he ever clicks submit.
He just put together a free video that walks through the four strategies behind every name on that list.
You'll see the trade structure. The setups. The exit rules. The reasons most options traders blow up their accounts and how to not be one of them.
Watch the free options video breakdown - drop your email to start →
WMB's Steady Pipeline Climb: Natural Gas Strength and Your $500 Monthly Plan
Picture this: Five years ago, Williams Companies $WMB ( ▲ 0.5% ) stock traded around $27 per share. Today in June 2026, it closes at $73.12 — a solid +173% gain. The chart shows a consistent upward trend with good momentum in recent years, driven by natural gas transportation and infrastructure demand.
The 52-week high reached $80.08, showing the stock has already climbed higher during strong periods. Keeping it simple: The compound annual growth rate (CAGR) over these five years is about 22%. If this pace continues, it means reliable yearly gains that compound steadily over time.
Now imagine using dollar-cost averaging (DCA): adding $500 every month for the next five years. This totals $30,000 invested from your pocket over 60 months. You buy more shares on dips and fewer on rises, which helps keep your average cost balanced.
If WMB follows a similar historical pace around 22% annual growth, your monthly $500 contributions could grow your investment to approximately $52,000 by the end of five years. That means a gain of roughly $22,000 beyond what you put in — a solid 73% overall return from consistent investing.

Past performance doesn't guarantee the future — energy prices, demand changes, or market conditions can shift the path. But WMB is a major player in natural gas infrastructure with stable operations. Your $500 monthly plan stays simple and easy to maintain, letting compounding build steady value.
The ongoing need for reliable natural gas transport keeps supporting this sector. Staying disciplined through any temporary pullbacks is what usually leads to good long-term results.
Ready to build with this kind of energy infrastructure potential?
💡📊 Three Paths for $100K in 2026 — Income, Growth, or Stability in a Shifting Market
A $100,000 portfolio does not behave like a single number once it is placed into markets. It becomes a reflection of structure, not capital.
In 2026, three funds — SCHD, JEPQ, and SCHG — demonstrate this more clearly than most investors expect. Each one starts with the same money, yet each one produces a completely different outcome depending on whether the market favors value, income extraction, or growth acceleration.
What makes this comparison important is not just performance divergence. It is timing behavior. The first half of the year rewarded defensive positioning, while the most recent months shifted back toward technology leadership. That rotation has quietly reshaped which fund “looks right,” even though none of them changed structurally.
The real question is not which fund is winning today.
It is which fund still makes sense when the market regime shifts again.
Each of these vehicles represents a distinct philosophy:
SCHD reflects stability and dividend discipline
JEPQ reflects income extraction from volatility
SCHG reflects concentrated growth exposure
The difference is not cosmetic. It is mechanical, and it directly determines income, volatility, and long-term compounding.
$SCHD ( ▲ 0.41% ) — stability first, growth second
SCHD (Schwab U.S. Dividend Equity ETF) functions as the most defensive structure in this comparison. Its design avoids heavy reliance on technology leadership and instead tilts toward companies with durable cash flows.
On a $100,000 allocation, SCHD generates approximately $3,250 annually at a yield of about 3.25%, paid quarterly. That translates to roughly $813 per distribution cycle.
The fund’s return profile in early 2026 reflected a value-driven market environment. As capital rotated into defensive sectors such as consumer staples, healthcare, and energy, SCHD benefited from its existing positioning rather than tactical adjustment.
However, its recent behavior shows an important limitation. Over the last several months, returns slowed to roughly 3%, indicating that its earlier outperformance was tied closely to a specific market rotation rather than continuous leadership.
Risk characteristics remain relatively muted. Volatility is among the lowest of the three funds, and drawdowns tend to be shallower during market stress periods. That stability, however, comes with tradeoffs in upside capture during technology-led rallies.
Key equity exposure includes companies such as Coca-Cola, Pfizer, PepsiCo, and Chevron — firms that prioritize cash flow stability over rapid expansion.
SCHD’s role is best understood not as growth acceleration, but as capital preservation with income generation layered on top.
Half your market is one app away.

Your business is already on Instagram, SMS, and web chat. But 52 million immigrants in the US rely on WhatsApp to connect with businesses they trust — not email, not phone calls.
Wati helps you show up on WhatsApp and every channel they use. Are you still not there?
$JEPQ ( ▼ 1.18% ) — income engineered from equity volatility
JEPQ (JPMorgan Nasdaq Equity Premium Income ETF) operates with a fundamentally different objective. Instead of maximizing upside, it monetizes volatility through covered call writing on Nasdaq-100 holdings.
On a $100,000 allocation, JEPQ produces roughly $11,000 in annual income, or about $928 per month. This income is distributed monthly, making it structurally appealing for cash-flow-focused portfolios.
The tradeoff is explicit and quantifiable. The fund captures only a portion of underlying Nasdaq upside due to its options overlay. Recent data from JPMorgan shows that year-to-date capture has been significantly below full index participation, reflecting the cost of income generation.
Historically, capture rates tend to hover in the 60–70% range depending on market conditions, meaning a portion of gains is consistently exchanged for immediate income.
Top holdings overlap heavily with SCHG, including major technology names such as Microsoft, Apple, and Nvidia. Despite similar underlying exposure, performance outcomes differ due to the covered call overlay.
Another structural consideration is turnover, which is relatively high. This increases tax inefficiency in taxable accounts due to frequent realization of short-term gains from option activity.
JEPQ performs best in environments where markets are range-bound or moderately volatile. In strong upward trends, upside participation is capped. In sharp downturns, income provides partial cushioning but does not eliminate equity risk.
Its purpose is not capital maximization. It is engineered cash flow.
$SCHG ( ▲ 0.67% ) — concentrated growth with high sensitivity to momentum
SCHG (Schwab U.S. Large-Cap Growth ETF) represents the opposite end of SCHD’s philosophy. It concentrates heavily in growth-oriented sectors, primarily technology, communication services, and consumer discretionary.
Recent performance has strengthened alongside renewed momentum in large-cap technology. Over a recent three-month window, SCHG outpaced both SCHD and JEPQ by a wide margin, reflecting renewed investor preference for growth leadership.
On a $100,000 allocation, SCHG produces approximately $350 annually in income, reflecting its minimal dividend yield of roughly 0.33%. The fund is not structured for income; it is structured for capital appreciation.
However, this growth orientation comes with elevated concentration risk. The top ten holdings represent more than half of the portfolio, meaning performance is highly dependent on a small group of mega-cap companies.
Core exposure includes Microsoft, Apple, Nvidia, Amazon, and Alphabet — firms that have historically driven a large share of U.S. equity returns.
Valuation levels are also elevated relative to SCHD, with price-to-earnings ratios significantly higher, reflecting expectations embedded in growth stocks.
SCHG is most sensitive to interest rate expectations, liquidity conditions, and technology sentiment cycles. When these factors align positively, returns accelerate quickly. When they reverse, drawdowns tend to be sharper than diversified or income-focused alternatives.
The real decision behind the $100K allocation
When the three funds are placed side by side, the differences become structural rather than performance-based.
On a $100,000 allocation:
SCHD generates roughly $3,250 per year in dividends
JEPQ generates roughly $11,000 per year in monthly income
SCHG generates roughly $350 per year in dividends
At first glance, JEPQ appears dominant from an income perspective. SCHD appears balanced. SCHG appears inefficient for income purposes.
But the deeper insight is not income. It is composition.
SCHG and JEPQ share a significant overlap in underlying holdings, particularly in large-cap technology. The divergence between them is not what they own, but how returns are harvested. One sells volatility to generate income. The other retains full upside exposure.
SCHD stands apart entirely, built around defensive equities that behave differently across cycles.
This creates a simple but powerful framework:
SCHD represents stability when markets rotate away from growth.
SCHG represents acceleration when growth dominates market leadership.
JEPQ represents monetized volatility when income is prioritized over upside.
The key realization is that these funds are not competing products in the traditional sense. They are responses to different market environments.
For 2026 specifically, market leadership has not been static. Early value strength gave way to renewed technology momentum, and income strategies have continued to distribute cash regardless of direction.
The implication is straightforward: the “best” fund is not universal. It depends entirely on whether the objective is compounding, income extraction, or volatility control.
No single allocation captures all three without compromise.
Closing perspective — matching money to function, not emotion
The most important distinction in this comparison is functional clarity.
Markets will continue shifting between value-driven rotations, technology-led expansions, and volatility-heavy transitions. Each of the three funds responds differently to those conditions, not because of skill differences, but because of design.
SCHD reduces volatility at the cost of upside.
SCHG maximizes upside at the cost of income stability.
JEPQ converts upside into immediate monthly cash flow.
A $100,000 portfolio does not need to choose the “best” fund. It needs to choose the correct function for the environment it expects — and accept that no single structure performs best in all conditions.
That is the part most portfolios miss: performance is temporary, but structure is permanent.
Ready to Revolutionize Your Wealth?
Here's what's waiting for you:
📈 Step-by-Step Guide: Start Investing in Minutes with Our Chosen Online Broker
🔍 Expert Insights: Uncover the Strategies Behind Our Recommended Smart Portfolios
💼 Easy Diversification: Gain Exposure to a Wide Range of Assets with Just a Few Clicks
💰 Long-Term Growth Potential: Build a Portfolio for Consistent Returns Over Time.

💸 Paying the bills
What if your money could drive itself to your goals?
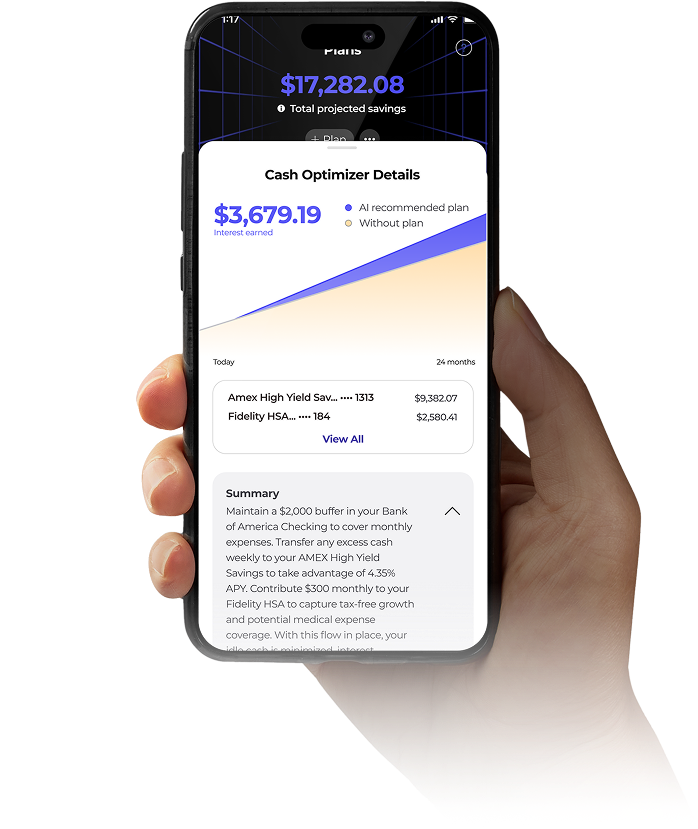
Any bank, any account, Piere makes it possible. In seconds, Piere analyzes your spending, income, wants, and goals, then creates fully automated plans for your money to follow.
- Save money automatically when you get paid — your money moves itself to the right account at the right interest rate
- Repay debt and stay debt free - Piere smartly determines which accounts to pay and when for the biggest impact
- Spend smarter — Piere keeps only the money you need for monthly expenses in your checking, moving the rest to high-yield accounts for safekeeping (and less temptation)
Get started in just seconds, and if you don't grow by at least $120 in your first year, we’ll give you back the difference.
Learn More
efind - Brain food is delivered daily. Every day, we analyze thousands of articles and send you only the best, tailored to your interests. Loved by 510,562 curious minds. Subscribe.

TOP MARKET NEWS
Top Market News - June 28, 2026
Can You Retire With an ETF-Only Portfolio?
Investors explore whether a fully ETF-based portfolio can sustain long-term retirement needs through diversification and low-cost exposure.
VIG vs SCHD: Core Dividend ETF Debate for Retirement Portfolios
Analysts compare two popular dividend ETFs as potential core holdings for a $500,000 retirement portfolio strategy.
Best Dividend ETFs for Building Long-Term Income
Income-focused ETFs remain a key strategy for investors seeking stable cash flow and long-term portfolio growth.
A Relaxed Approach to Retirement Investing Gains Attention
Investors increasingly adopt a more relaxed, long-term mindset toward retirement planning and market volatility.
Advertise with Investing Wise Academy
Elevate your financial brand with targeted exposure to savvy investors and market enthusiasts.
Partner with Us
PROMO CONTENT
Can email newsletters make money?
As the world becomes increasingly digital, this question will be on the minds of millions seeking new income streams in 2026.
The answer is—Absolutely!

That’s it for this episode!
Thank you for taking the time to read today’s email! Your support is what allows me to send out this newsletter for free every day.
What do you think of the new format? Please provide your feedback in the poll below, and if you find the newsletter valuable, feel free to share it with other investors!
How would you rate today's newsletter?
Disclaimer: This newsletter is for informational purposes only and should not be considered financial advice. Please consult with a financial advisor before making any investment decisions.